Article Media
Five months into the pandemic, California's COVID-19 data collection is still fragmented and incomplete. Along with the serious technical failures, our state is missing racial and ethnic data for more than 35% of known cases, and the data we do collect varies from county to county. What is clear is that the cracks in our understanding of the virus' spread is matched by cracks in our response. Although the picture is patchy, the data that has emerged shows devastating racial disparities in who COVID infects and kills.
The ACLU is calling on every California county to create a local task force dedicated to addressing the racial/ethnic disparities in COVID-19 data collection, impacts, and outcomes. This letter follows an earlier letter to Governor Newsom asking the state to create better data accountability standards. In order to be successful, the task forces need to include leadership from Black, Indigenous, and Latinx led organizations. The communities most impacted by the pandemic possess the greatest understanding of their own needs, and must be given a seat at the table.
Right now, fewer than 5 out of the 58 California counties have task forces. The result is a patchwork of inconsistent and partial information that is very difficult to pull together. To illustrate the problem, we worked with a data scientist who collected the data provided by every county, synthesized it, and analyzed the racial disparities. Accompanying the graphs is a recounting of the challenges our data scientist encountered while trying to collect and process this data.
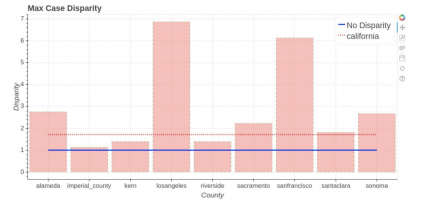
The above graph gives a visual representation of the severity of racial disparities in COVID cases across different counties in California. The below graph provides the same information, except for deaths. Disparity is defined as the ratio between the percentage of an ethnic group's cases/deaths and their demographics in the county. So, a disparity of 2 means that a population is represented twice as much in COVID cases/deaths than would be expected if there were no underlying socioeconomic issues.
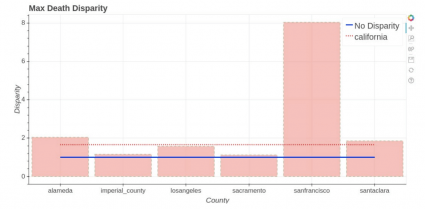
These charts shows that in essentially every Californian county, at least one ethnic group is being disproportionately harmed by the virus. For example, in Alameda, Latinx populations are about 2.6 times more likely to test positive for COVID than their population would indicate, while Black people are twice as likely to die from COVID as their population would suggest, despite being underrepresented in COVID cases. It is also clear that the level of disparity in both cases and deaths are higher in counties containing densely populated cities.
However, although this information is telling, there are still substantial gaps. While analyzing the data, two primary problems emerged:
- Inconsistency in definition of race and ethnicities: While the state of California reports 7 identifiable ethnicities, others counties report different numbers of identifiable ethnicities, some of which have changed over time. Imperial County, for example, reports only two (Hispanic and non-Hispanic).
- Inconsistency in the way data is stored: Moreover, different counties store data on different websites that are formatted in discrepant ways. For example, we had to parse raw data gathered from Sacramento’s website in three different ways over the course of a single month. Likewise, Riverside County gathered data in six ways in one month. This inconsistency makes in-depth analysis difficult for both the government and outside groups.
California has to get this right, and creating localized task forces is a key part of the solution. We need better data, and we need more representative voices to actually understand the scope of the problem, and the potential solutions. In this vein, we implore every country to take the following steps:
- Create a task force designed to address the racial and ethnic disparities in COVID-19 impacts, responses, and outcomes.
- Include at least one leader of a Black, Indigenous, or Latinx led organization in each task force.
- Be transparent - upon creation of the task force, the county should release the names and affiliations of all members.
- Work with the state to standardize data via a centralized platform where different counties can report data in a consistent way.
- Dedicate staff, or a small group of people, whose job is to reconcile disparate sources of data and keep up with any local changes.
Read our letter to the counties here: https://www.aclunc.org/sites/default/files/2020.08.12_Statewide_COVID-19_Racial_Disparity_Task_Force_Letter_final.pdf
Read our letter to Governor Newsom here: https://www.aclunc.org/covid-19-letter-governor-newsom-equity-data-collection
The data analysis was provided by Ohi Dibua